 Sunday, November 15 is World Day of Remembrance for the 1.3 million people annually who die as a result of traffic crashes around the world. In the United States, nearly 40,000 people are killed each year; that’s a startling number, even against the backdrop of the coronavirus pandemic that has so dramatically pushed road safety, gun violence, and the opioid epidemic off the front pages in 2020.
It’s easy to be overwhelmed with so many crises occurring simultaneously. Unfortunately, we can’t afford to take our eyes off any of them, or be complacent about how well we are tackling something as pervasive as road traffic violence. Late last month, the International Transport Forum published a 2020 Road Safety Update from 43 countries, including the United States. The extensive reporting on long-term trends provides comparable road safety data from 2000 to 2017/18 from each country – you can see the USA report here.
I was struck by a couple of things. First, I noticed Sweden experienced a shocking 28.6% increase in fatalities in 2018 compared to the prior year. Seventy-two additional fatalities in 2018 raised their annual total from 252 to 324. That’s 324 for the whole country; we killed that many people (330) in Nevada alone, or Iowa (318). Of course, Sweden is smaller (10 million people) and any increase is a cause for concern, but for goodness sake. If the USA had followed Sweden’s trajectory since 2000, instead of 37,000 dead in 2017 the toll would have been 10,400 people. Again, a horrible number but that’s a difference of some 26,600 lives that would not have been lost (and that’s making the comparison with Sweden’s worst year in more than a decade) and a powerful reminder of how far we have to go in this country.
Overall, the US generally starts behind in 2000 and falls further behind other countries during the following 18 years, even as the US report tries to celebrate great progress. For example, the US experienced 11.4 fatalities per 100,000 population in 2017, which was down from 14.9 in 2000. That’s great news, except when you compare that with other countries: Canada went from 9.5 fatalities per 100k population in 2000 to 5 in 2017; the Dutch saw their numbers fall from 7.3 to 3.6; Sweden fell from 6.7 to 3.2; and the Danes reduced their fatalities from 9.3 per 100,000 people to just 3.
Ah, but, I hear you say. We travel more and live in a bigger country…. The United States suffered 7.2 fatalities per 1 billion vehicle kilometers traveled in 2017, which is a 24% reduction since 2000. Framed this way, it sounds like good news again. However, Canada had a 49% reduction over the same time to 4.8. The Netherlands also saw a 49% reduction to 4.7. Sweden: a 55% drop to 3.8. And Denmark: a 71% drop to 3.1 fatalities per 1 billion kms traveled. Once again, it seems like we could be doing better.
Statistics are tricky, right? So, may be it’s fairer if we judge things against the number of vehicles…after all, we’ve got a lot of vehicles in the United States. In 2000, we were seeing 1.9 fatalities per 10,000 registered vehicles; in 2017 that was down to 1.3. Denmark actually started with a higher number…2.1 fatalities per 10,000 vehicles. Now (2018), that number has fallen to 0.5. Canada went from 1.6 to 0.7, the Netherlands from 1.4 to 0.6 and Sweden fell from 1.2 to 0.5 fatals per 10,000 vehicles.
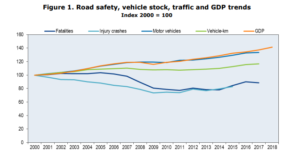
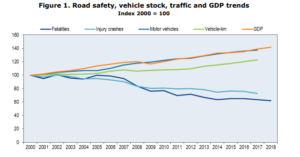
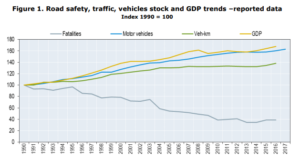
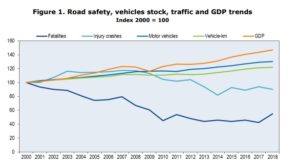
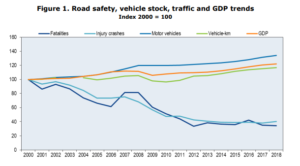
Sorry, that’s a lot of numbers. What does this look like in chart form? The charts below are taken straight out of the ITF reports for each country and the important thing to look at is the gap between the top three lines (motor vehicles, vehicle kilometers, and GDP) and the fatality and injury lines at the bottom. In the USA chart, the lines all stay quite close together (arguably the only real decline in US fatalities is during the last recession; that’s a whole other Insight post). In the other countries, regardless of economic indicators and travel patterns, fatalities and injuries come steadily down. By 2017, the gap is significant.
United States
Canada
Netherlands:
Sweden:
Denmark:
Each and every fatality and serious injury has a massive human and societal cost that’s hard to account for and acknowledge. For many years, NHTSA has calculated the economic cost of crashes, but this ITF report goes even further and includes “quality of life” losses as well as the more direct costs of property damage, emergency services, loss of earnings etc. Adding in the quality of life factor dramatically increases the numbers. In 2010, the economic cost of crashes using the traditional NHTSA methodology was $242 billion…adding in the losses related to degraded quality of life increases that number to $835.8 billion. For bicyclist and pedestrian crashes alone, this increases the cost of crashes from $16bn to $87bn. That seems significant to me, and suggests that it’s well worth investing in traffic safety in a more systemic and deliberate manner.
The World Day of Remembrance reminds us that behind every one of these statistics there is a human life and an intricate web of family, friends, and co-workers whose lives are also changed forever by their loss. That’s why we do the work we do on Vision Zero, to a create a safe system and eliminate these tragedies forever. The ITF reports are a timely reminder that the US can and must do better.