This post is authored by Safe Routes to School Practice Lead Diane Lambert, MPH and Project Planner Ayden Cohen.
In 2019, crash data from the Philadelphia Vision Zero for Youth Demonstration Project, led by the Pedestrian and Bicycle Information Center (PBIC), revealed some compelling statistics: 61% of youth pedestrian crashes occurred outside Philadelphia’s High-Injury Network, and over half happened on seemingly “safe” two-lane streets with 25-mph speed limits and low traffic volumes. These findings affirmed what Safe Routes to School (SRTS) practitioners have long known anecdotally but often lack the detailed data to prove: Children and youth are active road users, and they’re getting hurt in areas that many safety analyses are overlooking — closer to home; near schools, parks, and playgrounds; and on low-speed, low-volume streets.
If our goal is to create communities where everyone can move safely, we need to address youth travel patterns and safety needs in all planning efforts. That means integrating youth-focused data — not just in SRTS projects, but in active transportation plans, Vision Zero strategies, and Complete Streets policies. The latest round of Safe Streets and Roads for All funding renews the national emphasis on safety policies and projects. There is supplemental funding available to develop SRTS plans that provide further detail on youth travel than a typical safety action plan, and demonstration and implementation funding to put SRTS strategies into action.
Read on to learn how Toole Design’s SRTS specialists and Safety practitioners are working together to ensure that youth safety is a core element in all our safety planning efforts.
Understand the data — and its limitations
At Toole Design, we take a critical look at crash data and ask, “What can this data tell us about youth? Or, what does the lack of youth data tell us?”
When possible, disaggregate crash data by age group to understand youth needs. At a minimum, we examine school-aged youth (ages 5–18). Breaking this down further by distinguishing between younger children (ages 5–14) and driving-aged youth (ages 15–18) can inform more targeted interventions. We have used this approach as part of state safety action planning efforts and have identified relevant takeaways on how youth crash locations, types, and outcomes differ from all-age crashes.
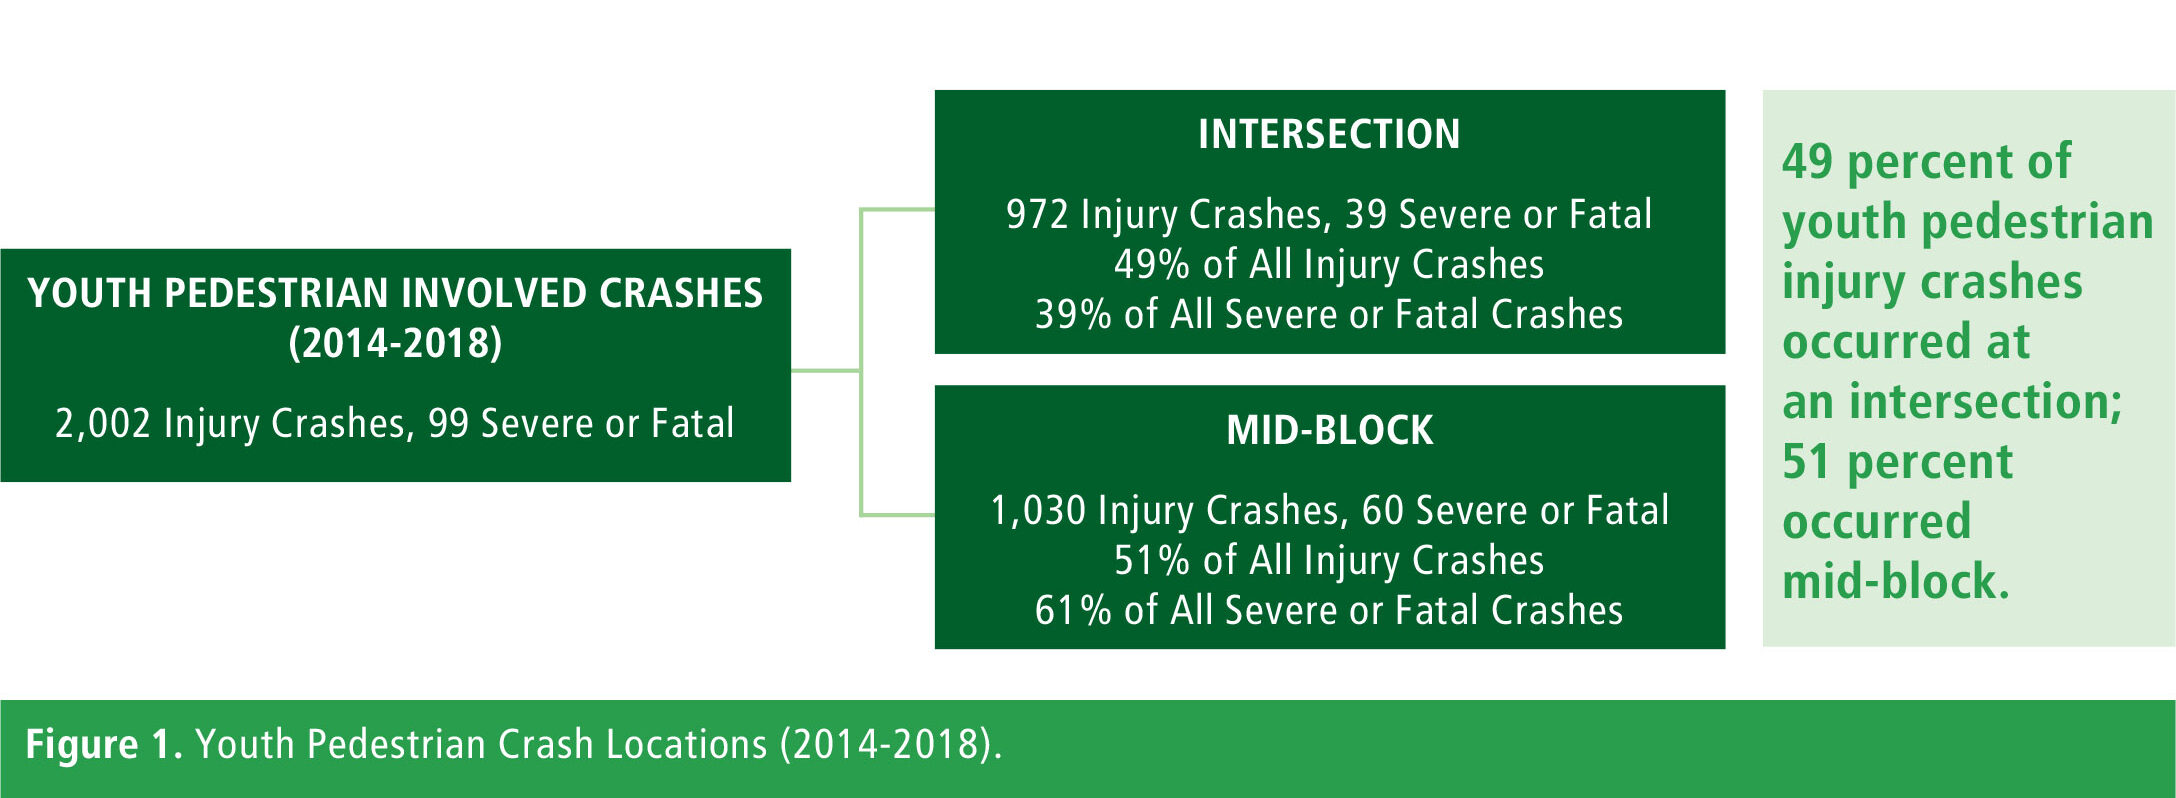
When detailed crash data is available, create a “youth crash tree” to identify youth-specific crash patterns and priorities. Are school-aged vulnerable road user crashes occurring more often at intersections or midblock? On roads with two lanes or four? Are there differences in locations and road characteristics for severe and fatal crashes compared to lesser–injury? Findings from a youth crash tree can identify specific combinations of factors that may pose a higher risk for children compared to adults — valuable information that can supplement the High-Injury Network.
However, it’s also important to acknowledge the limitations of crash data, especially for children and youth. Under-reporting of pedestrian crashes via police reports is well-documented, especially for crashes with less severe injuries, and it occurs at even higher rates when children are involved.
Whether they include youth-specific takeaways or not, crash analyses should acknowledge these data limitations. Doing so not only paints a more accurate picture of safety challenges, but also highlights the need for improved crash reporting methods and intentional engagement with children and youth.
When data falls short, listen to the community
If data is incomplete (i.e., lacking person-level details like age), it is critical to supplement crash analysis with qualitative data. Talking directly with children, families, and school staff can lead to critical insights that even the most detailed datasets cannot capture.
For example, we recently held a focus group with high school students to inform our development of a safety action plan. Hearing directly from students provided us with a deeper understanding of their travel patterns, concerns, and behaviors. We learned that wider sidewalks and more bicycle and pedestrian education would make a big difference in making them feel safer.
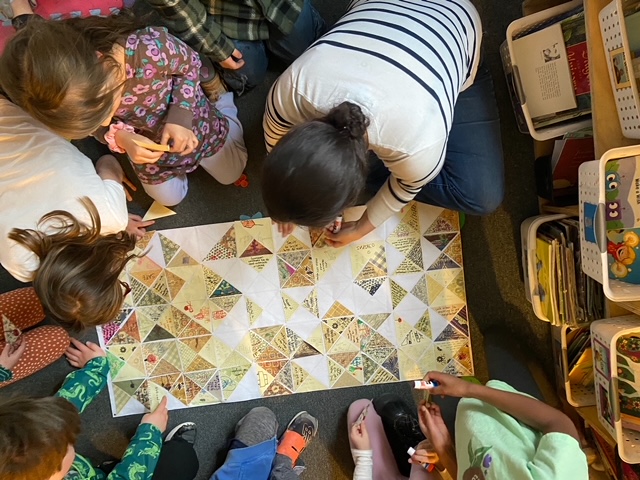
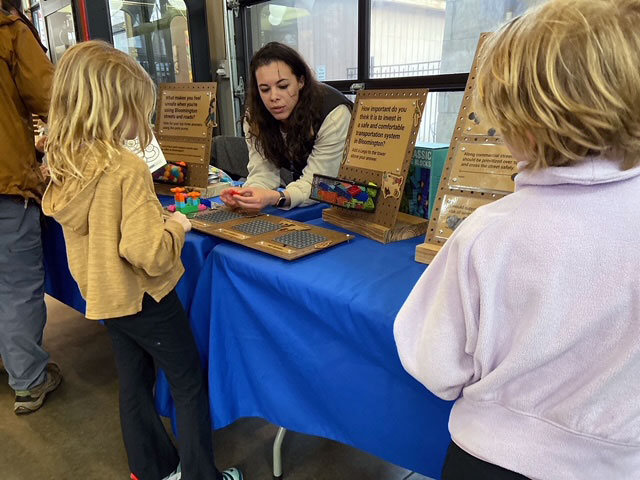
Similarly, in Bloomington, Indiana, leading an engagement activity in a middle school lunchroom uncovered insights we could not have gotten from speaking with adults. We found that a significantly higher percentage of middle school participants selected “fear of physical or verbal harassment” as a top concern compared to adult respondents. This variation is likely due to middle school students mostly being on foot, bike, or scooter and, in general, feeling threatened by adults.
Most importantly, make youth safety a key message
Whatever the project, youth safety should always be part of the story. Every crash summary, planning document, and public engagement event should address youth in some way, whether by reporting data on youth crashes, gathering feedback from youth themselves, or acknowledging that youth are underrepresented and calling for a more nuanced assessment of their safety needs. Expressing this critical message early in the planning process sets the tone for considering youth in later stages and ensures that youth aren’t left out of strategies and recommendations.
Even when insights from analysis and engagement are limited, planners should message what broader research already tells us:
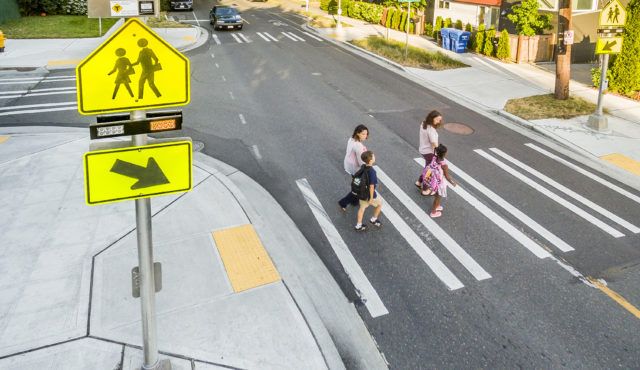
- Children have different travel patterns than adults. Children frequently travel to destinations near where they live, such as schools, parks, playgrounds, and friends’ houses, often at off-peak hours.
- Children have different cognitive abilities than adults. Children can have difficulty judging safe gaps in traffic and using cognitive and motor skills simultaneously. Even older youth lack experience and the skills to anticipate driver errors.
- Children are more vulnerable than adults to crashes. Children’s growing bodies make them more susceptible to impacts from all types of crashes. As the U.S. vehicle fleet shifts toward larger SUVs and trucks, with higher front ends and larger blind spots, this risk is growing.
- Child-safe streets benefit the whole community. Investments in child-focused improvements are rarely single-purpose — youth safety improvements benefit all road users and strengthen local transportation networks.
As we continue to invest in safety planning and projects, let’s consistently ask: How does this impact youth? Can every child walk, bike, and roll safely in this neighborhood? Let’s take our focus on vulnerable road users one step further by centering the most vulnerable: our children.